When someone asks, “Will this GPU actually run that game?”—they’re really asking a much bigger question than it seems. They’re asking about silicon lithography, memory bandwidth, thermal headroom, driver maturity, engine optimization, resolution scaling, and the quiet war between raw compute and clever software. The beautiful thing about fps benchmarks is that they collapse all of that complexity into a single, honest number: frames per second. That number doesn’t lie, doesn’t market, doesn’t care about your brand loyalty. And in 2026—with memory prices volatile, tariffs reshuffling supply chains, and AI workloads squeezing every last watt out of consumer hardware—honest numbers matter more than ever.
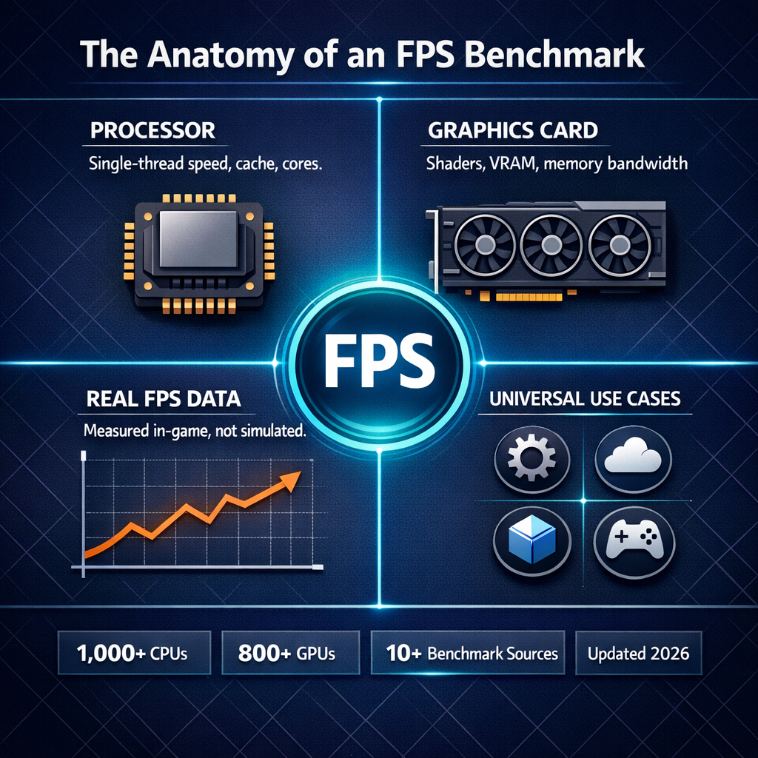
This is why platforms like FPSBench have quietly become essential reading for gamers, system integrators, IT procurement teams, and even machine-learning engineers who repurpose gaming GPUs for inference clusters. The site aggregates real-world FPS data across hundreds of processors and graphics cards, cross-referencing titles like Cyberpunk 2077, Counter-Strike 2, Red Dead Redemption 2, Valorant, and Microsoft Flight Simulator with industry-standard synthetic benchmarks including Passmark, Geekbench, 3DMark, and Cinebench. According to FPSBench’s own figures, the platform catalogs more than 1,000 CPUs and over 800 GPUs, tested against 10+ benchmark sources by a team of ten-plus hardware specialists.
Why FPS Benchmarks Still Matter—Even in an AI-First World
The global gaming market is projected to reach roughly $269 billion in 2025, according to Mordor Intelligence, while the narrower PC gaming segment was valued at $86.12 billion in 2025 with a forecast to climb to $96.69 billion in 2026 (Fortune Business Insights). Gaming hardware alone represented a record $44.5 billion slice of that pie in 2025. Those numbers matter because they fund the very research and engineering that trickles into every other silicon vertical.
Jensen Huang, NVIDIA’s co-founder and CEO, put it bluntly at COMPUTEX 2024: “Accelerated computing is sustainable computing.” He followed that with his now-legendary one-liner, “The more you buy, the more you save”—a quip about how GPU acceleration cuts total power consumption per unit of work. Whether you agree with the CEO math (Tom Warren of The Verge famously teased that it’s “not accurate, but it is correct”), the underlying engineering point holds. FPS benchmarks, at their core, measure how efficiently a system converts electrons into rendered frames—and that ratio is now the foundational metric for gaming, generative AI, simulation, and scientific visualization alike.
The 2026 GPU Landscape: A Lopsided Arena
The discrete GPU market is not a fair fight. Jon Peddie Research reported that in Q4 2025, NVIDIA reached 94% share of add-in board shipments, AMD dropped to roughly 5%, and Intel held steady at about 1%. For context, AMD exited Q4 2024 with around 17% share; it lost more than two-thirds of its discrete footprint in a single year, largely because the Blackwell-based GeForce RTX 50 series flooded the channel while the RDNA 4–based Radeon RX 9070 series never gained traction with gamers.
Here’s a snapshot of the cards shaping FPS charts in 2026, pulled from current FPSBench listings:
| GPU | VRAM | TGP | Shader Count | Release |
|---|---|---|---|---|
| NVIDIA GeForce RTX 5090 | 32 GB GDDR7 | 575 W | 21,760 | 2025 |
| NVIDIA GeForce RTX 5080 SUPER | 24 GB | 415 W | — | 2026 |
| NVIDIA GeForce RTX 5070 Ti SUPER | 16 GB | 350 W | — | 2026 |
| NVIDIA GeForce RTX 5070 SUPER | 18 GB | 275 W | — | 2026 |
| AMD Radeon RX 9070 XT | 16 GB | — | — | 2025 |
| AMD Radeon AI PRO R9700 | 32 GB | 300 W | — | 2025 |
| Intel Arc Pro B60 | 24 GB | 200 W | — | 2025 |
If you’re evaluating gpus for a specific workload, the real lesson in that table isn’t the leader—it’s the spread. A 575 W RTX 5090 and a 43 W Radeon RX 7400 are in the same product category; they just live on opposite ends of the physical possibility curve.
CPUs: The Quiet Half of the FPS Equation
Ask any competitive Counter-Strike 2 or Valorant player what ruined their 360Hz dream, and you’ll often hear “CPU bottleneck” before “GPU.” At 1080p low settings, frame rates are routinely gated by single-thread performance, cache size, and inter-core latency—not shader throughput. That’s why the AMD Ryzen 7 9800X3D, with its 3D V-Cache stacked right on top of the CCD, has become the de facto esports chip of this generation.
Lisa Su, chair and CEO of AMD, framed the broader compute picture during a February 2026 Purdue lecture: “Compute equals intelligence.” She then hardened the point from an operator’s perspective: “Today, it is all about how much computing you can get with a set amount of power.” For anyone choosing cpu models for a rendering farm, a game server, or a personal gaming rig, that’s not abstract philosophy—it’s the entire procurement rubric.
A compact view of the CPU talent pool currently tracked on FPSBench:
| Processor | Cores / Threads | Boost | TDP | Target Use |
|---|---|---|---|---|
| AMD Ryzen Threadripper PRO 9995WX | 96C / 192T | 5.4 GHz | 350 W | Workstation, VFX, AI |
| AMD Ryzen 9 9950X3D | 16C / 32T | — | — | Gaming + Creation |
| AMD Ryzen 7 9800X3D | 8C / 16T | 5.0 GHz | 120 W | Pure gaming |
| Intel Core Ultra 9 285K | — | — | — | Gaming + Productivity |
| Intel Core Ultra 7 265K | — | — | — | Mainstream enthusiast |
| AMD Ryzen 5 7500F | 6C / 12T | 5.0 GHz | 65 W | Budget gaming |
| Intel Xeon 6978P | 120C / 240T | — | 500 W | Server / HPC |
Notice the range: six cores at 65 watts up to 120 cores at 500 watts, all indexed by the same underlying benchmarking philosophy. That versatility is what makes FPS—and the broader family of per-workload benchmarks—a universal yardstick.
How FPSBench Actually Builds Its Data
The platform runs a layered methodology. At the top, it aggregates real FPS data from controlled in-game tests across titles like Grand Theft Auto V, Fortnite, Call of Duty: Warzone, Palworld, Microsoft Flight Simulator, Ark: Survival Ascended, and Hitman 2. Underneath those numbers sit synthetic benchmark scores (3DMark Time Spy, Cinebench R23, Geekbench 6, Passmark) that help validate outliers and expose driver-level anomalies.
The site also exposes three practical tools that turn raw data into decisions:
- Rate My PC — gives a user’s full system a composite performance rating.
- Can I Run It? — checks a specific game against a specific build.
- What Games Can I Run? — inverts the question and lists compatible titles for any hardware profile.
That framing matters because most users don’t actually want a number—they want a decision. The academic lineage of this approach traces back decades; for a deeper treatment, the MIT OpenCourseWare Computer System Architecture course remains a free, rigorous foundation covering pipelining, cache hierarchies, and parallel processing—the underlying mechanics every FPS benchmark ultimately measures.
Industries That Now Depend on the Same Silicon
The classic gamer is no longer the primary consumer of high-end GPUs. Consider the fan-out:
Artificial intelligence and machine learning. Every frontier model trained in 2025–2026 ran on a derivative of the same GPU architecture that powers Cyberpunk 2077. Hyperscalers buy Hopper and Blackwell data-center parts; indie ML researchers repurpose RTX 4090s and 5090s for local fine-tuning. CUDA, ROCm, and OneAPI have turned gaming silicon into the universal substrate of modern AI.
Professional workstations. Architects rendering Revit models, VFX artists in Houdini and Unreal Engine, film colorists in DaVinci Resolve, and industrial designers in SolidWorks all lean on cards like the NVIDIA RTX PRO 6000 Blackwell (96 GB) and AMD Radeon AI PRO R9700 (32 GB). FPS, in these contexts, translates directly to viewport interactivity and iteration speed.
Scientific and academic high-performance computing. Universities and national labs deploy the same silicon families to model climate systems, fold proteins, simulate fusion plasmas, and accelerate drug discovery. Lisa Su once observed during the pandemic that “high-performance computing technology plays a critical role in modern viral research,” a line that aged into prophecy as AlphaFold and successors rewrote structural biology.
Data centers and cloud providers. CoreWeave, Lambda, AWS, Azure, GCP, and Oracle Cloud all resell GPU compute as a rentable commodity. The unit economics ultimately rest on benchmarks—not branding.
Servers and enterprise infrastructure. Intel Xeon 6 processors (up to 120 cores, 240 threads) and AMD EPYC Embedded chips handle databases, virtualization, and containerized microservices, while secondary GPUs handle video transcoding, analytics acceleration, and inference.
Automotive and robotics. Autonomous driving stacks, Tesla-style neural nets, and Amazon warehouse robots rely on edge-grade silicon (NVIDIA Jetson T4000/T5000, AMD Ryzen Embedded V3C series) benchmarked with the same rigor as desktop parts.
Medical imaging. CT reconstruction, MRI post-processing, and pathology slide analysis all depend on GPU throughput. A hospital radiology suite might use the same RTX 4090 a teenager uses to play Valorant—one reads tumors, the other headshots.
Content creation and streaming. Twitch and YouTube streamers, podcasters, and indie filmmakers rely on NVENC/AV1 hardware encoders, which are benchmarked implicitly through streaming FPS stability. The rise of platforms such as modern streaming and media delivery platforms further reinforces this demand.
Finance and quantitative trading. Monte Carlo risk simulations, high-frequency trading backtests, and options pricing models routinely run on GPU clusters. Latency, throughput, and deterministic FPS-style metrics matter even when no pixels are being drawn.
Cybersecurity and reverse engineering. Password cracking, hash analysis, malware sandboxing, and firmware inspection workflows lean heavily on CUDA/OpenCL. Analysts using modern streaming and media delivery platforms often pair CPU-heavy transcoding with GPU-accelerated encoding routines.
Home and casual users. Windows 11 adoption, 4K streaming, AI-assisted photo editing in Lightroom, and local LLM runtimes like Ollama mean even “normal” households now benefit from discrete graphics.
What the Benchmarks Reveal About Price-to-Performance in 2026
Memory prices spiked aggressively in late 2025 due to AI-driven DRAM demand, and Trump administration tariffs injected further uncertainty. Dr. Jon Peddie, president of Jon Peddie Research, summarized the market tension: “The AIB market, largely supported by gamers, is being squeezed from the bottom by powerful new notebooks and CPU integrated graphics, and from the high end by rising pricing due to competition (supply and demand), memory prices, and Trump administration tariffs that bounce around.” His firm forecasts a 10% year-over-year decline in the add-in board market for 2026.
That’s precisely why the price-to-performance tooling on FPSBench—its CPU Value and GPU Value rankings—has become so actionable. A $300 Ryzen 5 7500F paired with a $350 Radeon RX 7700 XT or a $400 RTX 5060 Ti often delivers 85–90% of a $1,600 flagship’s real-world FPS in e-sports titles. For the vast majority of players and professional users, that’s the rational buy.
A Compact “Benchmark Profile” Object
For technical readers, here’s a conceptual data object of what a single FPSBench comparison row looks like in practice:
{
  "hardware": {
    "cpu": "AMD Ryzen 7 9800X3D",
    "gpu": "NVIDIA GeForce RTX 5070 Ti",
    "ram": "32 GB DDR5-6000",
    "resolution": "2560 x 1440",
    "preset": "High"
  },
  "games_tested": [
    {"title": "Cyberpunk 2077", "avg_fps": 142, "1%_low": 98},
    {"title": "Counter-Strike 2", "avg_fps": 438, "1%_low": 312},
    {"title": "Microsoft Flight Simulator", "avg_fps": 88, "1%_low": 61},
    {"title": "Red Dead Redemption 2", "avg_fps": 126, "1%_low": 84}
  ],
  "synthetic": {
    "3dmark_time_spy": 21840,
    "cinebench_r23_multi": 25210,
    "geekbench_6_single": 3380
  },
  "value_rating": "A-"
}
This is the level of structured comparison the platform enables—and it’s why procurement teams, streamers, and research labs increasingly treat it as a reference source rather than a gaming-enthusiast curiosity.
The Human Side of the Benchmark
There’s a reason people obsess over frame rates. A stable 240 FPS in a competitive shooter isn’t vanity; it’s a measurable advantage in reaction time. A locked 60 FPS in a single-player RPG is the difference between immersion and a broken spell. An AI workstation holding 40 inferences-per-second on a 70-billion-parameter model is the difference between productive iteration and staring at a spinner.
Lisa Su has offered advice that applies equally to engineers and enthusiasts: “Run towards problems.” When hardware is expensive, software is unpredictable, and tariffs move weekly, the best defense is better data. That’s ultimately what FPSBench sells—data good enough to make decisions you won’t regret two years later, whether you’re buying a single laptop for college or racking a hundred GPUs for an AI startup. Those same disciplines underpin rigorous software functional testing in enterprise contexts, where reproducibility and measurement methodology matter just as much as raw performance.
Final Thoughts
Benchmarks have always been about trust. A frame rate you measured yourself is worth a hundred marketing slides. In 2026, with silicon costs climbing, AI workloads eating into gaming supply, and new architectures from NVIDIA Blackwell, AMD RDNA 4, and Intel Battlemage / Arc Pro B-series competing for every design win, that trust is more valuable than ever. FPSBench’s approach—real FPS numbers, transparent synthetic scoring, open comparison tools—turns a chaotic market into something you can actually navigate.
Whether you’re building a home theater PC, specifying a finance firm’s quant cluster, equipping a university lab, or finally upgrading from that aging GTX 1060, the honest answer to “is this worth it?” usually lives inside a well-run benchmark. And right now, in the post-doctoral era of accelerated computing, that benchmark increasingly starts with a single question: what’s the FPS?